Bayesian Generalized Linear Models with Metropolis-Hastings Algorithm
Generalized Linear Models
import pandas as pd
import numpy as np
import matplotlib.pyplot as plt
import seaborn as sns
from scipy.stats import norm, poisson
We are going to take a problem-solving based approach to GLMs. The only conceptual leap you will need to make is the idea of a link function.
Binomial Likelihood
Bot Detection
Suppose you wanted to predict the probability of a twitter account being a bot using common attributes of the account, such as the ratio of followers to following and the lifetime of the account. How would you design this model?
n = 1000
ratio = np.random.exponential(size = n, scale = 1)
lifetime = np.random.exponential(size = n, scale = 1)
nu = 1 - 2 * ratio - lifetime
p = 1 / (1 + np.exp(-nu))
bot = np.random.binomial(p = p, n = 1)
bot.mean()
0.231
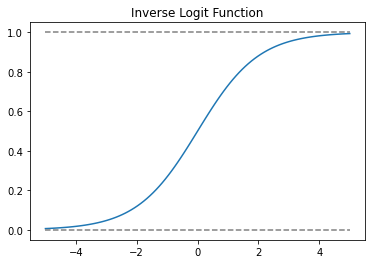
xx = np.linspace(-5, 5, 100)
plt.plot(xx, 1 / (1 + np.exp(-xx)))
plt.plot(xx, np.ones(100), linestyle = '--', color = 'grey')
plt.plot(xx, np.zeros(100), linestyle = '--', color = 'grey')
plt.title('Inverse Logit Function')
plt.show()
def inv_logit(x):
    return 1 / (1 + np.exp(-x))
def prior(b0, b1, b2):


    b0_prior = norm.pdf(x = b0, loc = 0, scale = 10)

    b1_prior = norm.pdf(x = b1, loc = 0, scale = 10)

    b2_prior = norm.pdf(x = b2, loc = 0, scale = 10)

    ######################

    # log probability transforms multiplication to summation

    return np.log(b0_prior) + np.log(b1_prior) + np.log(b2_prior)


def likelihood(b0, b1, b2):


    nu = b0 + b1 * ratio + b2 * lifetime
    p = inv_logit(nu)
    log_likelihoods = bot * np.log(p) + (1 - bot) * np.log(1 - p)
    ######################

    # log probability transforms multiplication to summation
    return np.sum(log_likelihoods)


def posterior(b0, b1, b2):

    return likelihood(b0, b1, b2) + prior(b0, b1, b2)


def proposal(b0, b1, b2):

    b0_new = np.random.normal(loc = b0, scale = 0.1)

    b1_new = np.random.normal(loc = b1, scale = 0.1)

    b2_new = np.random.normal(loc = b2, scale = 0.1)

    return b0_new, b1_new, b2_new
def metropolis(steps):

    beta_steps = np.zeros((steps, 3))
    beta_steps[0, :] = np.zeros(3)


    for step in range(1, steps):

        b0_old, b1_old, b2_old = beta_steps[step - 1, :]


        b0_new, b1_new, b2_new = proposal(b0_old, b1_old, b2_old)

        # Use exp to restore from log numbers
        accept_ratio = np.exp(posterior(b0_new, b1_new, b2_new) - posterior(b0_old, b1_old, b2_old))
        ######################

        if np.random.uniform(0, 1) < accept_ratio:

            beta_steps[step, :]  = b0_new, b1_new, b2_new

        else:

            beta_steps[step, :]  = b0_old, b1_old, b2_old

    return beta_steps
chain1 = metropolis(10000)
chain_df = pd.DataFrame(chain1, columns = ['intercept', 'ratio', 'lifetime'])
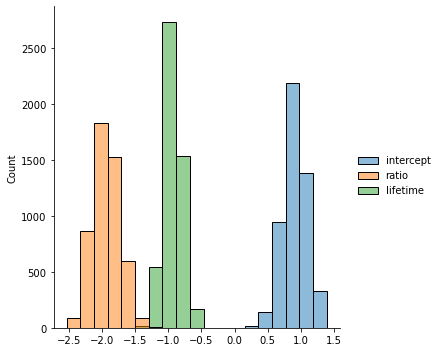
sns.displot(chain_df[5000:])
<seaborn.axisgrid.FacetGrid at 0x7f6e20683c70>
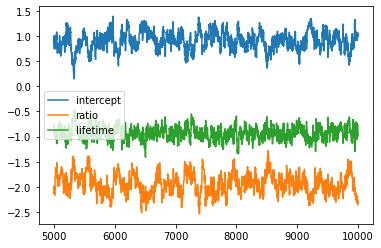
plt.plot(chain_df[5000:])
plt.legend(chain_df.columns)
plt.show()
Lefthand Advantage
The data in data(UFClefties) are the outcomes of 205 Ultimate Fighting Championship (UFC) matches. It is widely believed that left-handed fighters (aka “Southpaws”) have an advantage against right-handed fighters, and left-handed men are indeed over-represented among fighters (and fencers and tennis players) compared to the general population. Estimate the average advantage, if any, that a left-handed fighter has against right-handed fighters. Based upon your estimate, why do you think lefthanders are over-represented among UFC fighters?
ufc = pd.read_csv('data/UFCLefties.csv', delimiter = ";")
ufc.head()
| fight | episode | fight.in.episode | fighter1.win | fighter1 | fighter2 | fighter1.lefty | fighter2.lefty | |
|---|---|---|---|---|---|---|---|---|
| 0 | 1181 | 118 | 1 | 0 | 146 | 175 | 1 | 1 |
| 1 | 1182 | 118 | 2 | 0 | 133 | 91 | 1 | 0 |
| 2 | 1183 | 118 | 3 | 1 | 56 | 147 | 1 | 0 |
| 3 | 1184 | 118 | 4 | 1 | 192 | 104 | 0 | 0 |
| 4 | 1185 | 118 | 5 | 1 | 79 | 15 | 0 | 0 |
win = ufc['fighter1.win'].to_numpy()
f1_lefty = ufc['fighter1.lefty'].to_numpy()
f2_lefty = ufc['fighter2.lefty'].to_numpy()
def prior(b):


    b_prior = norm.pdf(x = b, loc = 0, scale = 1)

    ######################

    # log probability transforms multiplication to summation
    return np.log(b_prior)

def likelihood(b):


    nu = b * (f1_lefty - f2_lefty)
    p = inv_logit(nu)

    log_likelihoods = win * np.log(p) + (1 - win) * np.log(1 - p)
    ######################

    # log probability transforms multiplication to summation
    return np.sum(log_likelihoods)

def posterior(b):

    return likelihood(b) + prior(b)

def proposal(b):

    b_new = np.random.normal(loc = b, scale = 0.5)

    return b_new
def metropolis(steps):

    beta_steps = np.zeros(steps)
    beta_steps[0] = 0

    for step in range(1, steps):

        b_old = beta_steps[step - 1]


        b_new = proposal(b_old)

        # Use exp to restore from log numbers
        accept_ratio = np.exp(posterior(b_new) - posterior(b_old))
        #######################

        if np.random.uniform(0, 1) < accept_ratio:

            beta_steps[step]  = b_new

        else:

            beta_steps[step]  = b_old

    return beta_steps
chain1 = metropolis(10000)
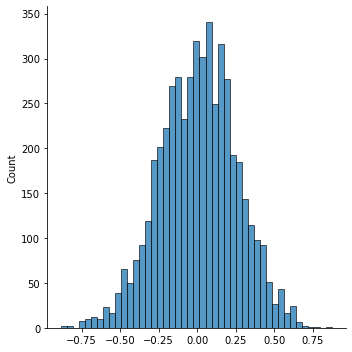
sns.displot(chain1[5000:])
<seaborn.axisgrid.FacetGrid at 0x7f6ddfb45d90>
plt.plot(chain1)
[<matplotlib.lines.Line2D at 0x7f6ddf77e670>]
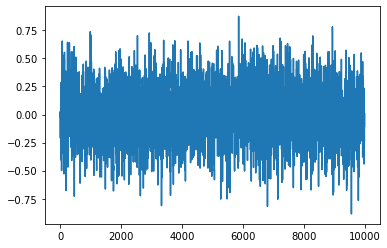
Why does there appear to be no advantage?
n = 1000
lefty = np.random.binomial(n = 1, p = 0.1, size = n)
ability = np.random.normal(size = n)
qualify = np.where((ability > 2) | ((ability > 1.25) & lefty), 1, 0)
(qualify & lefty).sum() / qualify.sum()
0.34375
np.random.seed(420)
k = 2 # importance of ability differences
b_sim = 0.5 # lefty advantage
l = lefty[qualify==1]
a = ability[qualify==1]
M = sum(qualify==1)
mid = int(M/2)
win = np.zeros(mid) # matches
f1_lefty = np.zeros(mid)
f2_lefty = np.zeros(mid)

for i in range(mid):
    a1 = a[i] + b_sim * l[i]
    a2 = a[mid + i] + b_sim * l[mid + i]
    p = inv_logit(k * (a1 - a2))
    f1win = np.random.binomial(n = 1, p = p, size = 1)
    win[i] = f1win
    f1_lefty[i] = l[i]
    f2_lefty[i] = l[mid + i]
chain1 = metropolis(10000)
sns.displot(chain1[5000:])
<seaborn.axisgrid.FacetGrid at 0x7f6ddf793400>
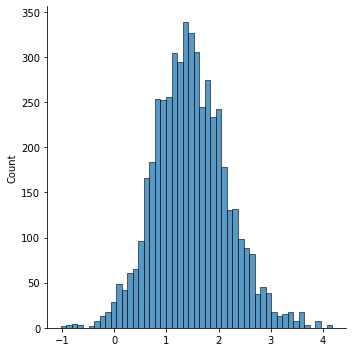
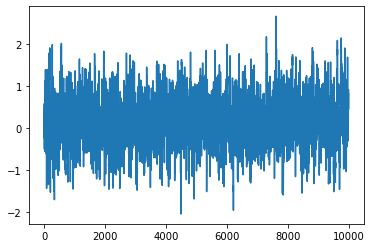
plt.plot(chain1)
[<matplotlib.lines.Line2D at 0x7f6ddf449f70>]
Poisson Likelihood
Counting Claims
Suppose you wish to estimate the number of automobile claims a policy holder will file over the life of a policy using the driver’s age and credit score (in 00s).
n = 1000
age = np.random.uniform(size = n, low = 16, high = 64)
credit = np.random.uniform(size = n, low = 3, high = 8.5)
nu = 6 - 0.5 * age ** (1/3) - 1.5 * credit
lam = np.exp(nu)
claims = np.random.poisson(lam = lam, size = n)
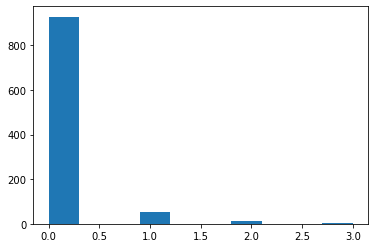
plt.hist(claims)
plt.show()
def prior(b0, b1, b2):


    b0_prior = norm.pdf(x = b0, loc = 0, scale = 10)

    b1_prior = norm.pdf(x = b1, loc = 0, scale = 10)

    b2_prior = norm.pdf(x = b2, loc = 0, scale = 10)
    ######################

    # log probability transforms multiplication to summation

    return np.log(b0_prior) + np.log(b1_prior) + np.log(b2_prior)


def likelihood(b0, b1, b2):


    nu = b0 + b1 * age ** (1/3) + b2 * credit
    lam = np.exp(nu)

    likelihoods = poisson(lam).pmf(claims)
    ######################

    # log probability transforms multiplication to summation
    return np.sum(np.log(likelihoods))


def posterior(b0, b1, b2):

    return likelihood(b0, b1, b2) + prior(b0, b1, b2)


def proposal(b0, b1, b2):

    b0_new = np.random.normal(loc = b0, scale = 0.01)

    b1_new = np.random.normal(loc = b1, scale = 0.01)

    b2_new = np.random.normal(loc = b2, scale = 0.01)

    return b0_new, b1_new, b2_new
def metropolis(steps):

    beta_steps = np.zeros((steps, 3))
    beta_steps[0, :] = np.array([5, 0, 0])


    for step in range(1, steps):


        b0_old, b1_old, b2_old = beta_steps[step - 1, :]


        b0_new, b1_new, b2_new = proposal(b0_old, b1_old, b2_old)

        # Use exp to restore from log numbers
        accept_ratio = np.exp(posterior(b0_new, b1_new, b2_new) - posterior(b0_old, b1_old, b2_old))
        #########################

        if np.random.uniform(0, 1) < accept_ratio:

            beta_steps[step, :]  = b0_new, b1_new, b2_new

        else:

            beta_steps[step, :]  = b0_old, b1_old, b2_old

    return beta_steps
chain1 = metropolis(10000)
/tmp/ipykernel_10118/599861409.py:17: RuntimeWarning: overflow encountered in exp
  accept_ratio = np.exp(posterior(b0_new, b1_new, b2_new) - posterior(b0_old, b1_old, b2_old))
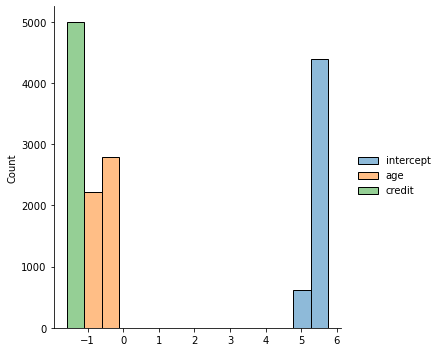
chain_df = pd.DataFrame(chain1, columns = ['intercept', 'age', 'credit'])
sns.displot(chain_df[5000:])
<seaborn.axisgrid.FacetGrid at 0x7f6ddfa7c2e0>
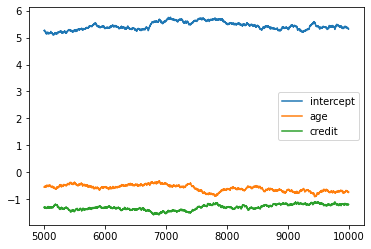
plt.plot(chain_df[5000:])
plt.legend(chain_df.columns)
plt.show()
pd.DataFrame(chain1[5000:]).describe()
| 0 | 1 | 2 | |
|---|---|---|---|
| count | 5000.000000 | 5000.000000 | 5000.000000 |
| mean | 5.429990 | -0.596091 | -1.310173 |
| std | 0.144655 | 0.119981 | 0.103329 |
| min | 5.097674 | -0.915226 | -1.590178 |
| 25% | 5.326552 | -0.688531 | -1.381540 |
| 50% | 5.409023 | -0.585485 | -1.316315 |
| 75% | 5.531647 | -0.497935 | -1.217022 |
| max | 5.756921 | -0.326036 | -1.101609 |
Counting Tools
The island societies of Oceania provide a natural experiment in technological evolution. Different historical island populations possessed tool kits of different size. These kits include fish hooks, axes, boats, hand plows, and many other types of tools. A number of theories predict that larger populations will both develop and sustain more complex tool kits. So the natural variation in population size induced by natural variation in island size in Oceania provides a natural experiment to test these ideas. It’s also suggested that contact rates among populations effectively increase population size, as it’s relevant to technological evolution. So variation in contact rates among Oceanic societies is also relevant.

kline = pd.read_csv('data/kline.csv', delimiter = ';')
kline
| culture | population | contact | total_tools | mean_TU | |
|---|---|---|---|---|---|
| 0 | Malekula | 1100 | low | 13 | 3.2 |
| 1 | Tikopia | 1500 | low | 22 | 4.7 |
| 2 | Santa Cruz | 3600 | low | 24 | 4.0 |
| 3 | Yap | 4791 | high | 43 | 5.0 |
| 4 | Lau Fiji | 7400 | high | 33 | 5.0 |
| 5 | Trobriand | 8000 | high | 19 | 4.0 |
| 6 | Chuuk | 9200 | high | 40 | 3.8 |
| 7 | Manus | 13000 | low | 28 | 6.6 |
| 8 | Tonga | 17500 | high | 55 | 5.4 |
| 9 | Hawaii | 275000 | low | 71 | 6.6 |
tools = kline.total_tools.to_numpy()
log_pop = np.log(kline.population.to_numpy())
contact = kline.contact.apply(lambda x: 1 if x == 'high' else 0).to_numpy()
from scipy.stats import poisson, norm
def prior(b0, b1, b2, b3):


    b0_prior = norm.pdf(x = b0, loc = 0, scale = 100)
    b1_prior = norm.pdf(x = b1, loc = 0, scale = 1)
    b2_prior = norm.pdf(x = b2, loc = 0, scale = 1)
    b3_prior = norm.pdf(x = b3, loc = 0, scale = 1)
    ######################

    # log probability transforms multiplication to summation
    return np.log(b0_prior) + np.log(b1_prior) + np.log(b2_prior) + np.log(b3_prior)

def likelihood(b0, b1, b2, b3):


    nu = b0 + b1 * contact + b2 * log_pop + b3 * contact * log_pop
    lam = np.exp(nu)
    likelihoods = poisson(lam).pmf(tools)
    ######################

    # log probability transforms multiplication to summation
    return np.sum(np.log(likelihoods))

def posterior(b0, b1, b2, b3):

    return likelihood(b0, b1, b2, b3) + prior(b0, b1, b2, b3)

def proposal(b0, b1, b2, b3):

    b0_new = np.random.normal(loc = b0, scale = 0.01)
    b1_new = np.random.normal(loc = b1, scale = 0.01)
    b2_new = np.random.normal(loc = b2, scale = 0.01)
    b3_new = np.random.normal(loc = b3, scale = 0.01)

    return b0_new, b1_new, b2_new, b3_new
def metropolis(steps):

    beta_steps = np.zeros((steps, 4))
    beta_steps[0, :] = np.zeros(4)


    for step in range(1, steps):


        b0_old, b1_old, b2_old, b3_old = beta_steps[step - 1, :]


        b0_new, b1_new, b2_new, b3_new = proposal(b0_old, b1_old, b2_old, b3_old)


        # Use exp to restore from log numbers
        accept_ratio = np.exp(posterior(b0_new, b1_new, b2_new, b3_new) - posterior(b0_old, b1_old, b2_old, b3_old))
        #########################


        if np.random.uniform(0, 1) < accept_ratio:

            beta_steps[step, :]  = b0_new, b1_new, b2_new, b3_new

        else:

            beta_steps[step, :]  = b0_old, b1_old, b2_old, b3_old

    return beta_steps
chain1 = metropolis(20000)
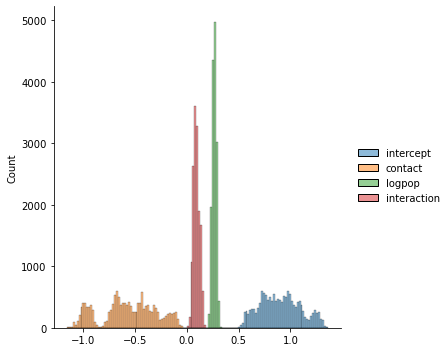
chain_df = pd.DataFrame(chain1, columns = ['intercept', 'contact', 'logpop', 'interaction'])
sns.displot(chain_df.iloc[5000:, :])
<seaborn.axisgrid.FacetGrid at 0x7f6ddf143d60>
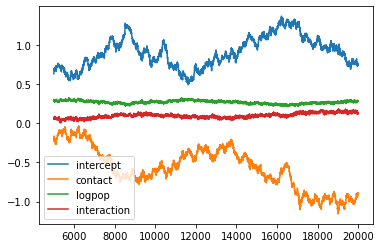
plt.plot(chain_df.iloc[5000:])
plt.legend(chain_df.columns)
plt.show()
chain_df.iloc[5000:].describe()
| intercept | contact | logpop | interaction | |
|---|---|---|---|---|
| count | 15000.000000 | 15000.000000 | 15000.000000 | 15000.000000 |
| mean | 0.904522 | -0.572605 | 0.267322 | 0.096037 |
| std | 0.195995 | 0.268268 | 0.019789 | 0.030269 |
| min | 0.489351 | -1.156353 | 0.210057 | 0.005709 |
| 25% | 0.751685 | -0.733303 | 0.253605 | 0.073918 |
| 50% | 0.897453 | -0.569403 | 0.267624 | 0.093761 |
| 75% | 1.046071 | -0.373637 | 0.281905 | 0.116540 |
| max | 1.363002 | -0.032650 | 0.326950 | 0.182332 |
No Contact Simulations
n = 10000
post = chain_df.iloc[-n:, :]
logpop = np.linspace(7, 13, 100)
nc_lower_89 = np.zeros(100)
nc_upper_89 = np.zeros(100)

for i, lp in enumerate(logpop):
    nu = post.intercept + post.logpop * lp
    lam = np.exp(nu)
    tools_sim = np.random.poisson(size = n, lam = lam)

    nc_lower_89[i], nc_upper_89[i] = np.quantile(tools_sim, q = (0.055, 1 - 0.055))
Contact Simulations
n = 10000
post = chain_df.iloc[-n:, :]
logpop = np.linspace(7, 13, 100)
c_lower_89 = np.zeros(100)
c_upper_89 = np.zeros(100)

for i, lp in enumerate(logpop):
    nu = post.intercept + post.logpop * lp + chain_df.contact.mean() + post.interaction * lp
    lam = np.exp(nu)
    tools_sim = np.random.poisson(size = n, lam = lam)

    c_lower_89[i], c_upper_89[i] = np.quantile(tools_sim, q = (0.055, 1 - 0.055))
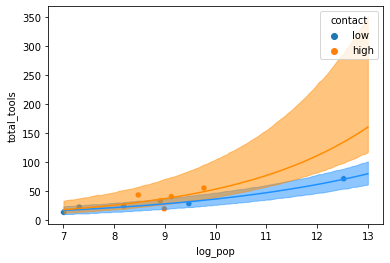
kline['log_pop'] = np.log(kline.population)
sns.scatterplot(x = 'log_pop', y = 'total_tools', data = kline, hue = 'contact')

### No Contact
nu = post.intercept.mean() + post.logpop.mean() * logpop
plt.plot(logpop, np.exp(nu), color = "dodgerblue")
plt.fill_between(logpop, nc_upper_89, nc_lower_89, color = "dodgerblue", alpha = 0.5)

### Contact
nu = post.intercept.mean() + post.logpop.mean() * logpop + post.contact.mean() + post.interaction.mean()*logpop
plt.plot(logpop, np.exp(nu), color = "darkorange")
plt.fill_between(logpop, c_upper_89, c_lower_89, color = "darkorange", alpha = 0.5)
plt.show()
On the natural scale
No Contact Simulations
n = 10000
post = chain_df.iloc[-n:, :]
pop = np.linspace(1000, 275000, 100)
nc_lower_89 = np.zeros(100)
nc_upper_89 = np.zeros(100)

for i, p in enumerate(pop):
    nu = post.intercept + post.logpop * np.log(p)
    lam = np.exp(nu)
    tools_sim = np.random.poisson(size = n, lam = lam)

    nc_lower_89[i], nc_upper_89[i] = np.quantile(tools_sim, q = (0.055, 1 - 0.055))
Contact Simulations
n = 10000
post = chain_df.iloc[-n:, :]
pop = np.linspace(1000, 275000, 100)
c_lower_89 = np.zeros(100)
c_upper_89 = np.zeros(100)

for i, p in enumerate(pop):
    nu = post.intercept + post.logpop * np.log(p) + post.contact + post.interaction * np.log(p)
    lam = np.exp(nu)
    tools_sim = np.random.poisson(size = n, lam = lam)

    c_lower_89[i], c_upper_89[i] = np.quantile(tools_sim, q = (0.055, 1 - 0.055))
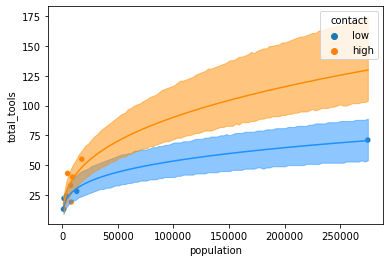
sns.scatterplot(x = 'population', y = 'total_tools', data = kline, hue = 'contact')

### No Contact
nu = chain_df.intercept.mean() + chain_df.logpop.mean() * np.log(pop)
plt.plot(pop, np.exp(nu), color = "dodgerblue")
plt.fill_between(pop, nc_upper_89, nc_lower_89, color = "dodgerblue", alpha = 0.5)

### Contact
nu = chain_df.intercept.mean() + chain_df.logpop.mean() * np.log(pop) + chain_df.contact.mean() + chain_df.interaction.mean()*np.log(pop)
plt.plot(pop, np.exp(nu), color = "darkorange")
plt.fill_between(pop, c_upper_89, c_lower_89, color = "darkorange", alpha = 0.5)
plt.show()
Sources:
Statistical Rethinking - Richard McElreath